Overview
This article provides information regarding the LanGuard logs location, their purpose, describes the LanGuard debug logs format, and helps with understanding the .csv logs format in particular.
Introduction
GFI LanGuard is using a GFI logger, which is writing text logs in the .csv files split by module, date, and size (rollover).
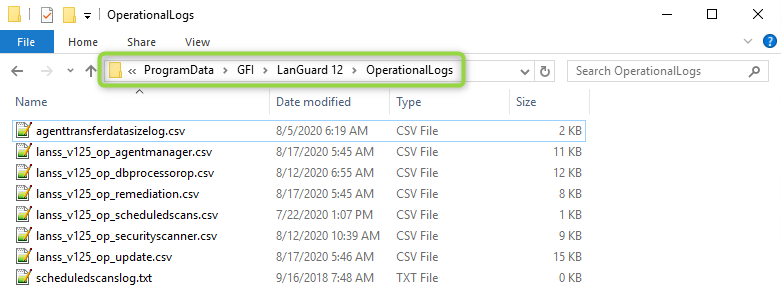
There are operational logs that record the major events of the main modules (debug does not have to be enabled). They provide a good starting point for troubleshooting and are located in the %Data%\GFI\LanGuard 12\OperationalLogs\ folder.
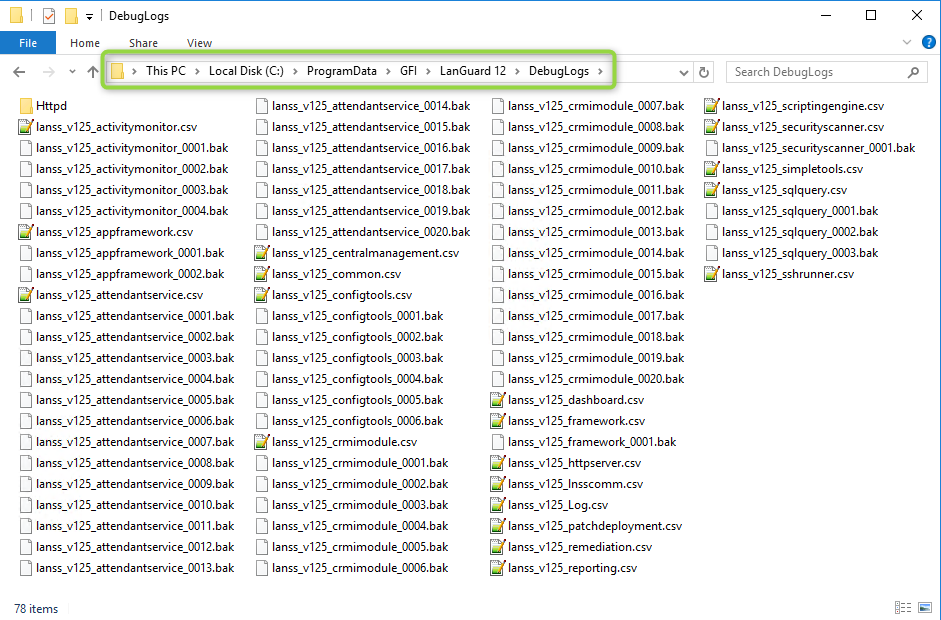
But much more information can be obtained by analyzing the debug logs. Debug logging in GFI LanGuard can be enabled from the registry on both the main application and the Agent machines. The logs are located in a subfolder of the data directory, %Data%\GFI\LanGuard 12\DebugLogs\.
Description
Operational Logs and Their Purpose
Below is a list of all GFI LanGuard operational logs created in %Data%\GFI\LanGuard 12\OperationalLogs\ folder and their purpose. Xxx in the file names (like lanss_vxxx_activitymonitor.csv) is the version number in real names (see screenshot above).
| Name | Purpose |
|---|---|
| agenttransferdatasizelog.csv | Operational log file which records the amount of data transferred between the server and the agents |
| lanss_vxxx_op_agentmanager.csv | Operational log for the Agent Manager component |
| lanss_vxxx_op_dbprocessorop.csv | Operational log for the DB Processor component |
| lanss_vxxx_op_remediation.csv | Operational log for the Remediation component |
| lanss_vxxx_op_scheduledscans.csv | Operational log for the Scan Manager component |
| lanss_vxxx_op_securityscanner.csv | Operational log for the Scanner component |
| lanss_vxxx_op_update.csv | Operational log for the Update component |
| scheduledscanslog.txt | Operational log for the Scheduled Scans component |
Debug Logs and Their Purpose
Below is a list of all GFI LanGuard debug logs created in %Data%\GFI\LanGuard 12\DebugLogs\ folder and their purpose. Xxx in the file names (like lanss_vxxx_activitymonitor.csv) is the version number in real names (see screenshot above).
Note: Highlighted items exist ONLY on machines where the main application is installed.
| Name | Purpose |
|---|---|
| \Httpd\access.log.xxxxxx | Logfile from Apache Server that stores all the incoming requests |
| \Httpd\error | Apache debug log file. The logging level can be controlled by editing the file %Data%\GFI\LanGuard 12\HttpdConfig\product\loglevel.conf |
| lanss_vxxx_activitymonitor.csv | Debug log file for the activity monitor which displays active scans, etc. |
| lanss_vxxx_analyze.csv | Debug log for the Dashboard |
| lanss_vxxx_apistrings.csv | Debug log file for the module which loads branding and language strings in the UI |
| lanss_vxxx_appframework.csv | Debug log file for the .Net application framework |
| lanss_vxxx_attendantservice.csv | Debug log file of the Attendant service. Contains logging for all the modules loaded by the Attendant service |
| lanss_vxxx_centralmanagement.csv | Debug log file that logs for the operations towards Central Management Server, even if it isn't installed |
| lanss_vxxx_common.csv | Debug log file that logs domain-related tasks, database connection, and schedule computation |
| lanss_vxxx_computergrouppropeties.csv | Debug log for the computer properties GUI |
| lanss_vxxx_configtools.csv | Debug log file for various modules used in displaying information in the configuration |
| lanss_vxxx_crmimodule.csv | Debug log file for the CRMI module – the module which is used to access the configuration database |
| lanss_vxxx_dashboard.csv | Debug log file for the LanGuard Dashboard |
| lanss_vxxx_framework.csv | Main debug log file for the UI – this will take care of launching the different modules required in the UI |
| lanss_vxxx_httpserver.csv | Debug log file for Apache Server |
| lanss_vxxx_lnsscomm.csv | Debug log file of LNSSCOMM – the module used for inter-process communication between the UI and the LNSS scanning engine, and between the LNSS Scanning engine and the scheduled scans module; which is loaded by the attendant service |
| lanss_vxxx_patchdeployment.csv | Debug log file for the patch deployment and custom patch deployment UI modules |
| lanss_vxxx_remediation.csv | Debug log file for the Remediation Center activities |
| lanss_vxxx_reporting.csv | Debug log file for the Scan filters UI |
| lanss_vxxx_scriptingengine.csv | Debug log file for the Script Engine module |
| lanss_vxxx_securityscanner.csv | Debug log file for the modules which are loaded by the Service Provider module |
| lanss_vxxx_simpletools.csv | Debug log file for the Simple Tools UI and operational modules |
| lanss_vxxx_sshrunner.csv | Debug log file for the SSH module – the module used to run SSH scripts |
| lanss_vxxx_sqlquery.csv | Debug log for the SQL queries |
Additionally, remediation job commands execution on the target machine is logged to the PatchAgent.log at %system%\Windows\Patches (unless otherwise changed in the settings).
Debug Logs Format
As seen in the screenshot in the Introduction section, the majority of LanGuard logs are stored in comma-delimited .csvformat, or as rollover .bak files. .csv is a popular file format and can be opened with lots of different tools.
CSV stands for "comma-separated values". The first line of each line is a header stating the list of fields, and each line afterward is a log record produced by one of the LanGuard components or modules.
Working with .csv logs is pretty straightforward, let's take a look at the file in Notepad++. You can use any other text editor instead. Alternatively, opening the logs in Excel can be useful to follow the specific threads or sort by particular entry types.
Below is the screenshot of the lanss_v125_attendantservice.csv logfile in Notepad++:
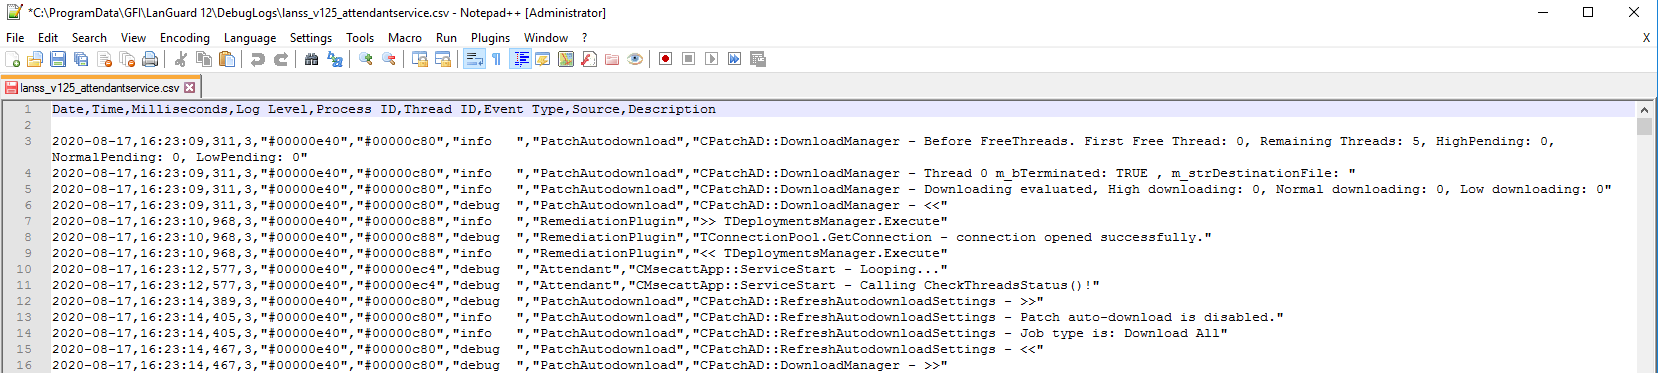
The top line shows the list of fields:
Date,Time,Milliseconds,Log Level,Process ID,Thread ID,Event Type,Source,Description
All logs in LanGuard use the same set of fields:
-
Date, Time, and Milliseconds = the time at which the event took place.
-
Log Level indicates the log level for the given event.
-
Process ID and Thread ID can be useful to follow a specific scan or a certain module.
-
Event Type is one of the main limiting items we use to filter the logs. Each line is identified by debug, info, warning, or error and we can limit our search to certain types.
-
Source is the individual module the debug line was created by. More on this will be covered in the LanGuard Services and Components.
-
Description is the actual occurrence of the event, including the commands run, files edited or connections established.
Now, aimed with the fields knowledge, let's look at the next non-empty line:
2020-08-17,16:23:09,311,3,"#00000e40","#00000c80","info ","PatchAutodownload","CPatchAD::DownloadManager - Before FreeThreads. First Free Thread: 0, Remaining Threads: 5, HighPending: 0, NormalPending: 0, LowPending: 0"
- First three fields define the date and time: 2020-08-17 16:23:09.311
- Next field (Log Level) value - 3 - indicates that debug mode is enabled.
- Next we see Process ID = #00000e40, and then Thread ID = #00000c80
- Next is Event Type = "info".
- The Source field indicates that the Patch Autodownload module recorded this log message.
- And finally, we see the Event Description, which in this case is nothing special, but when analyzing warnings, errors, or general process workflow, may provide important clues.
Priyanka Bhotika
Comments