Overview
The GFI LanGuard dashboard is made up of multiple tabs with different views, which enable real-time monitoring of scan targets and allow to perform instant remedial and reporting operations. This article contains information explaining the use of each tab within the LanGuard dashboard.
Introduction
The LanGuard dashboard consists of various tabs that allow users to manage their devices and groups efficiently.
Each tab represents a Dashboard view and allows monitoring and managing a device or group selected in the Computer Tree. The available views are:
Description
Overview Tab
The Overview tab provides a quick glance at the Vulnerability level of the selected device or group in the Computer Tree. Essentially it is a graphical representation of the security level/vulnerability level of a single computer, domain, or entire network.
However, this tab does not share the specific causes of these issues and only flags them here for further investigation. Settings of these alerts can be modified under the Security Sensors window.
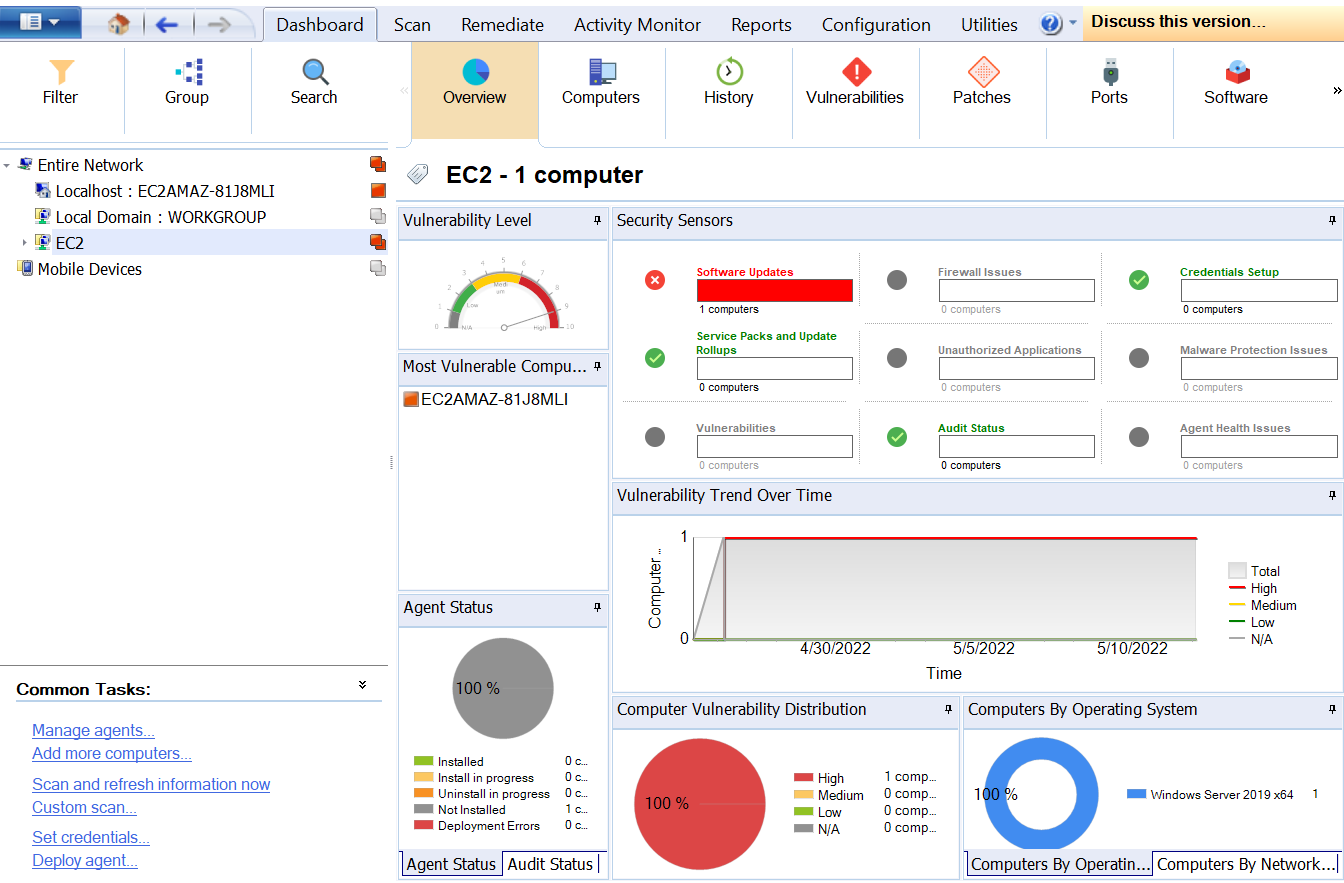
Note: By default, the LanGuard dashboard always opens with the Overview tab.
When a computer, group, or domain is selected, the results related to the selection are automatically updated in the dashboard. Below is a description of each section found in the dashboard:
 Not installed
 Pending installation
 Pending uninstall
 Installed
Computers Tab
The Computers tab provides a thorough overview of each machine and its current audit results in LanGuard. This tab is mostly used for troubleshooting credential issues across domains. It helps to trace machines whose functionality is affected due to incorrect use of credentials.
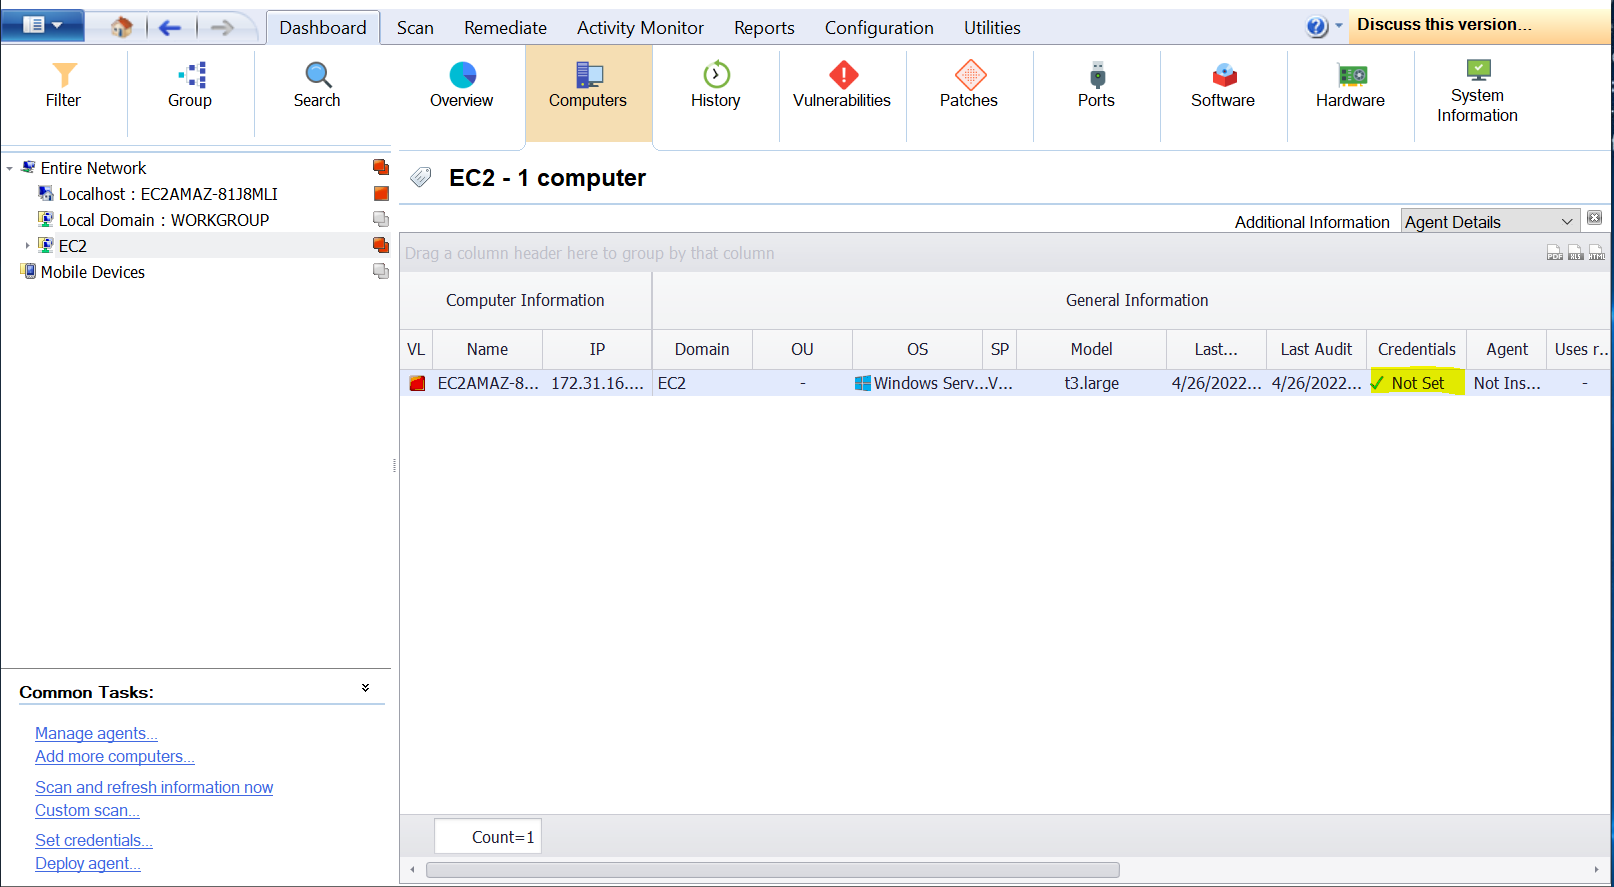
From the drop-down list, select one of the options described below:
| Section | Description |
|---|---|
| Agent Details | Select this option to view the agent status. This option enables you to identify if an agent is installed on a computer and if yes, displays the type of credentials being used by the agent. |
| Vulnerabilities |
View the number of vulnerabilities found on a computer grouped by severity. The severity of vulnerability can be:
|
| Patching status |
View the number of:
|
| Open ports |
View the number of:
|
| Software |
View the number of:
|
| Hardware |
View information on:
|
| System information |
View information on:
|
| Attributes | Adds an Attributes column and groups your scan targets by the assigned attribute. |
Note: To launch the Overview tab and display more details on a specific computer, double-click a computer from the list.
Note: Drag and drop a column header in the designated area to group data by criteria.
History Tab
Select this view to group audit results by date for a specific computer. View Settings top right link can be used to configure the history starting date or history period click the link provided.
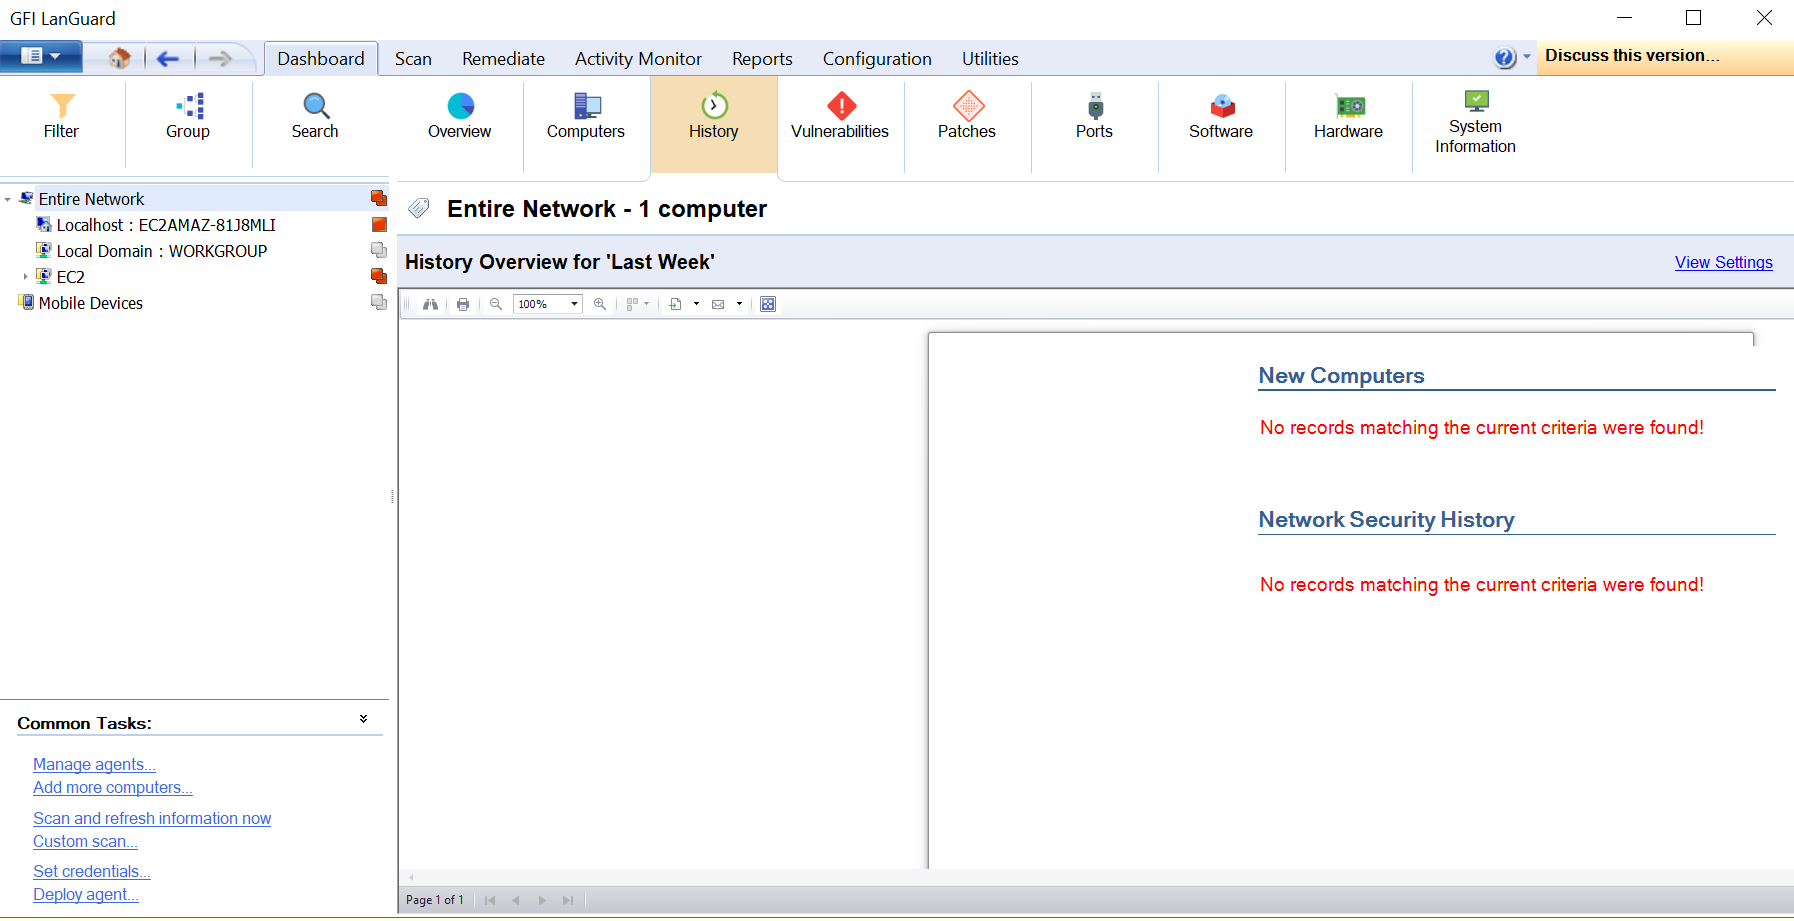
The History tab is actually running the Network Security History reports on the selected devices. This report can also be run manually from the reports section of the product as well.
Vulnerabilities Tab
This tab shares a list of flagged vulnerabilities based on CVE, OVAL, and various other scripted checks built into the GFI LanGuard. When a vulnerability is selected from the Vulnerability List, the Details section provides more information on the selected vulnerability. From the Details section click Affected computers or Unaffected computers to display a list of affected and unaffected computers.
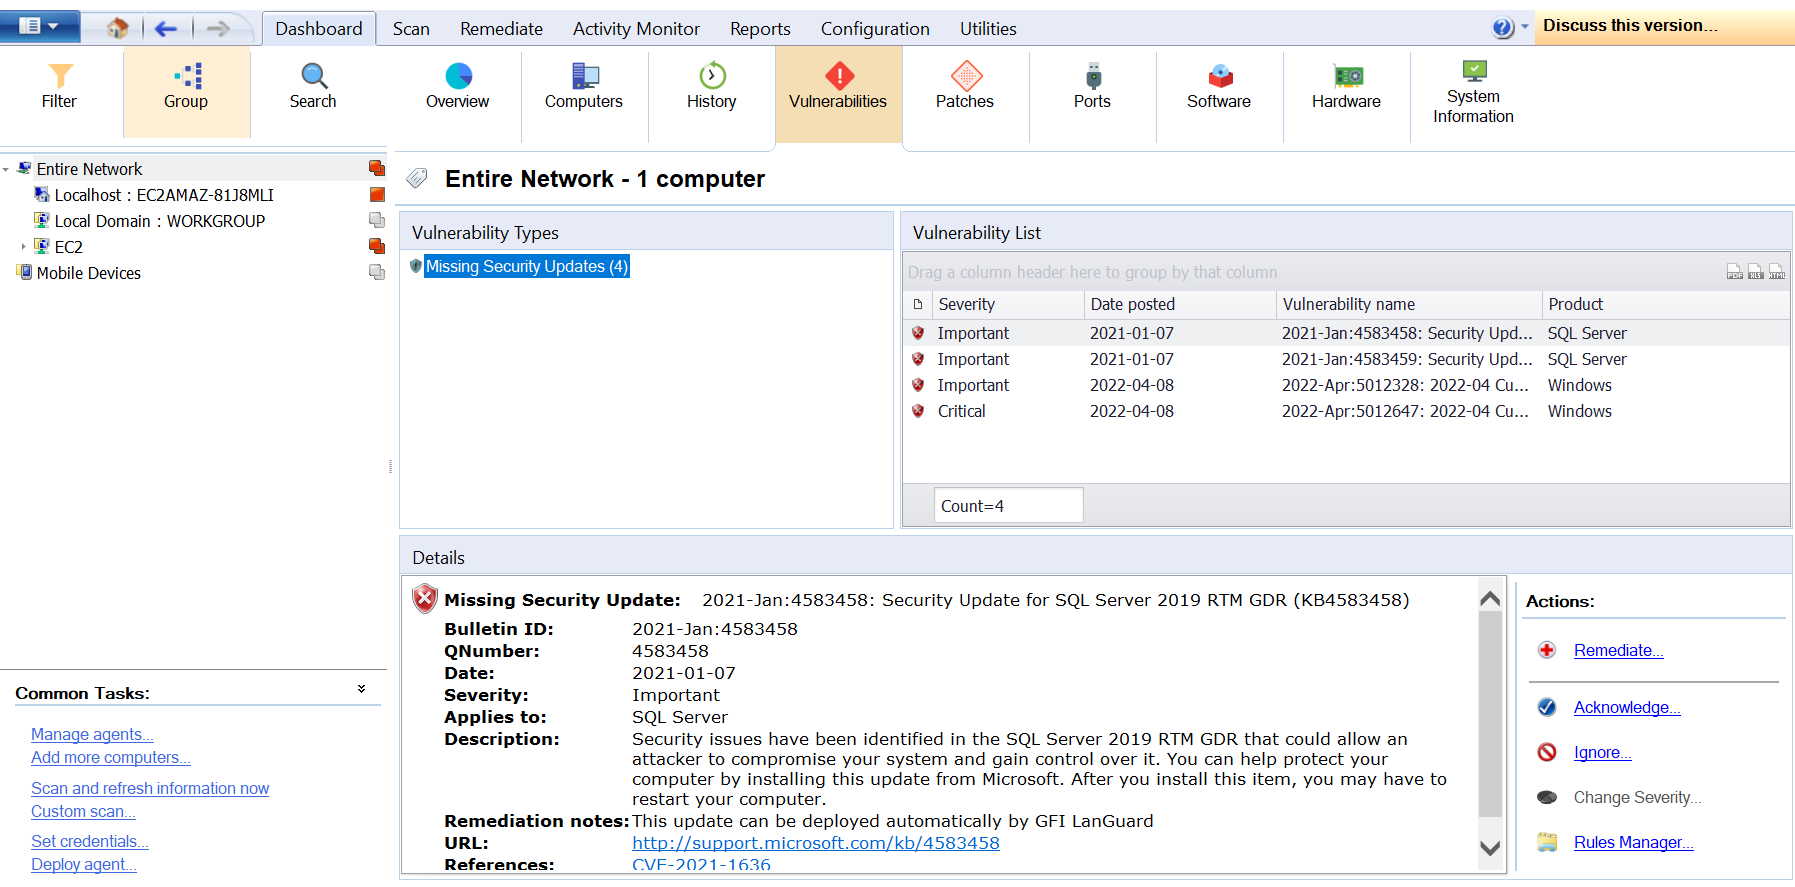
These vulnerabilities do not recommend a resolution and only function as alerts. In some cases, installing a patch will resolve the issue, and in others, registry edits are needed.
The tab also allows users to take certain Dashboard Actions on items.
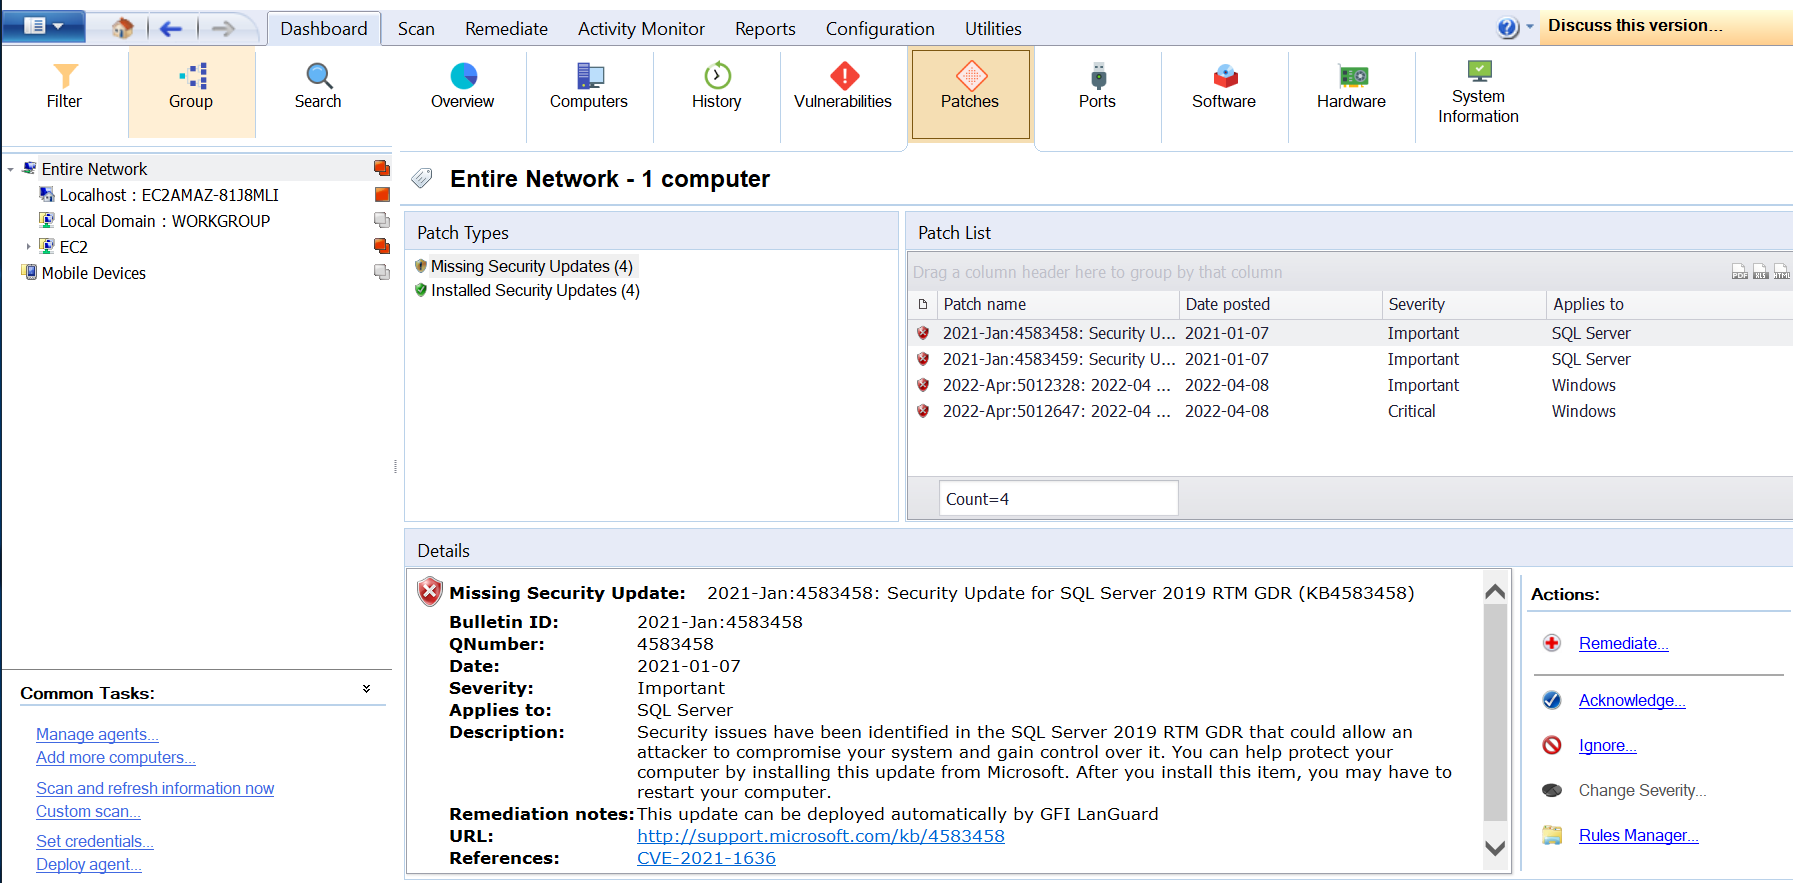
Patches Tab
The Patches tab is very similar to the Vulnerabilities tab except that it reports for applications and Microsoft updates the details on the missing/installed patches and service packs found during a network audit.
When a patch/service pack is selected from the list, the Details section provides more information on the selected patch/service pack. From the Details section, click Missing on to display a list of computers having the selected patch missing.
This tab also allows users to take certain Dashboard Actions on items, as seen on the screenshot below.
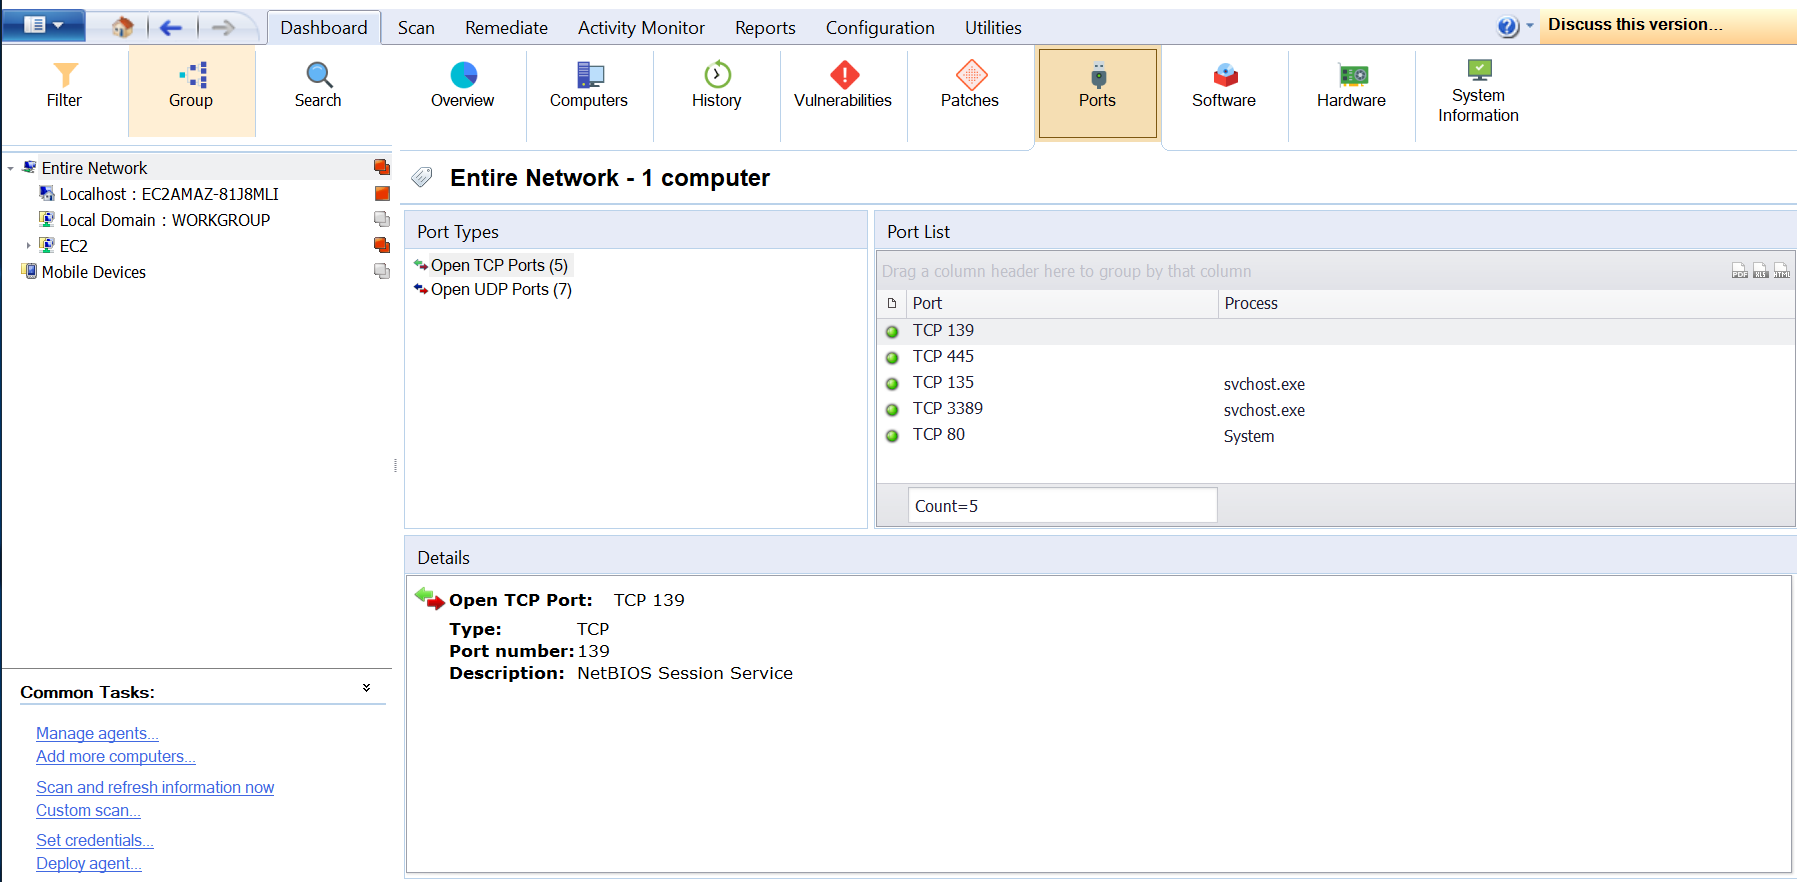
Ports Tab
This tab shows the results of the completed Port Scans - the details on the open ports found during a network audit. When a port is selected from the Port List, the Details section provides more information on the selected port. From the Details section, click View computers having this port open to display a list of computers having the selected port open.
Software Tab
This tab lists all the software installed on the selected devices found during a network audit. When an application is selected from the Application List, the Details section provides more information on the selected application.
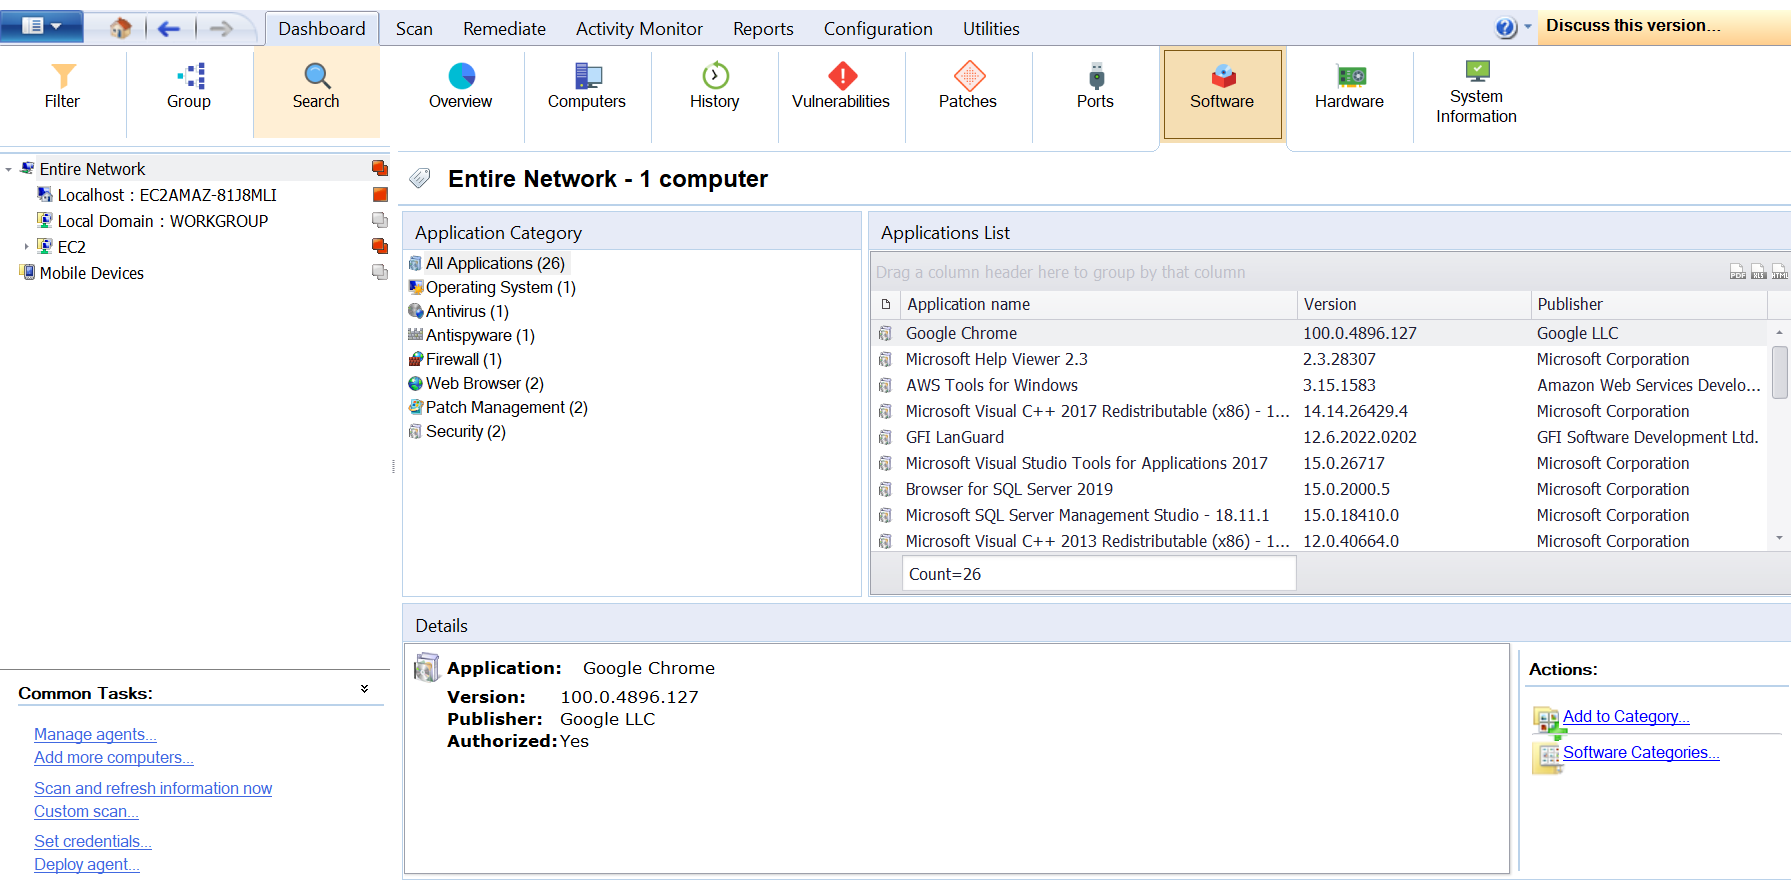
The Actions section allows users to add applications to a particular category or Configure rules for particular software categories and applications. For more information refer to Configure software categories.
Note: Agent-less scans require to temporarily run a service on the remote machine. Select Enable full security applications audit… to enable this service on all agent-less scanning profiles.
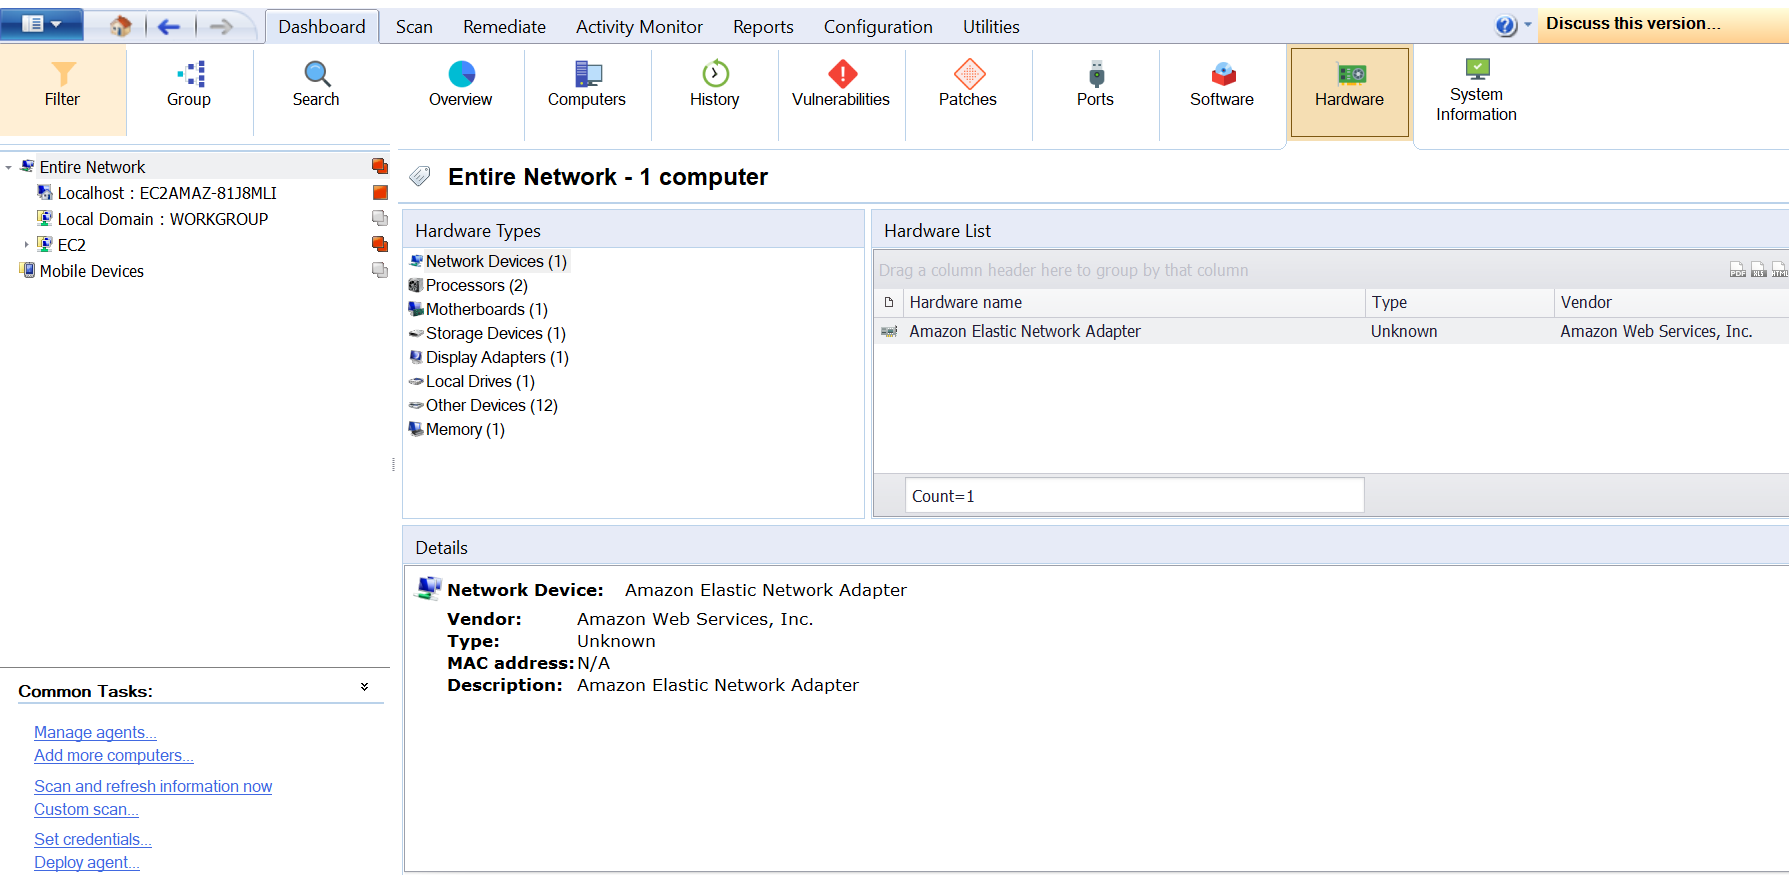
Hardware Tab
This tab lists information on the hardware found during a network audit. Select hardware from the list to display more details.
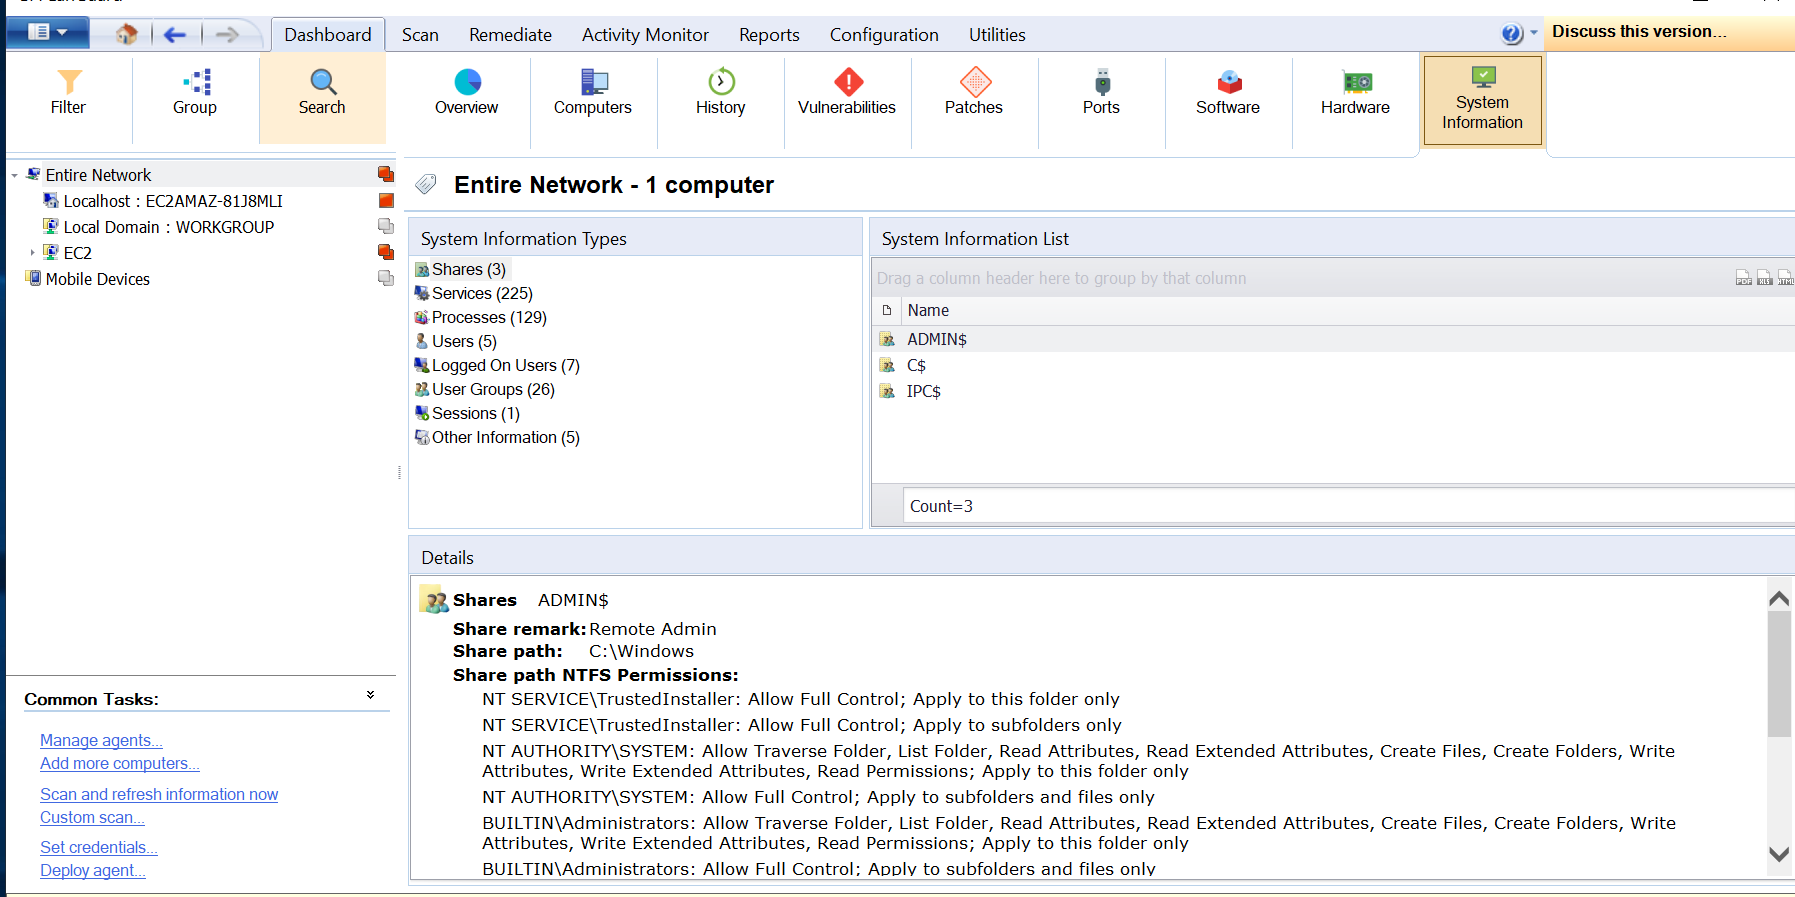
System Information Tab
This tab lists additional general information associated with the operating system about the selected device or group.
Priyanka Bhotika
Comments